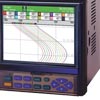
Typical Uses of Chart Recorders
Chart recorders are a familiar sight in manufacturing plants, where they track such variables as temperature, pressure, flow, pH,
and humidity. Laboratories, meanwhile, use them to monitor scientific and engineering data generated in testing, diagnostics,
statistical analysis, and other work requiring a graphic record.
When Should I Use a Chart Recorder?
When the process to be tracked involves limited variables that do not require a PC-based interface, paper and pen can still be the way to go.
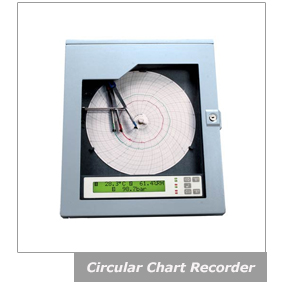
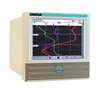
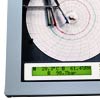
The advantage of a circular chart is its intuitiveness: at a glance, it gives a complete history of each selected variable over a specified period—a truly
continuous display of a trend’s change with time.
How to Select a Chart Recorder?
Many applications are suitable and require the installation of a chart recorders. Before choosing one, make sure you consider the following questions:
- How many inputs need to be recorded?
- What types of inputs need to be recorded?
- Do different input types need to be recorded in the same unit?
- What type of recording is required?
- Multiplex scanning (what minimum scan cycle is required?)
- Is a communciation interface required?
- Is recorder to be bench style or panel mounting?
- What type of instrument power is available?
- Is log-type recording desirable instead of/in addition to trend recording?
- Is color differentiation available for trend lines?
- Is message printing required?
- Is the recorder to perform alarm functions?
- How many setpoints per channel?
- What types of alarms: threshold, rate delta?
- Are physical relay contacts available for external alarm output?
Signal Inputs
Available Input Types
Typical process recorders accept analog dc voltage inputs, thermocouple, or RTD temperature inputs or dry contact status input.
Signal Processing
Linear scaling (conversion to engineering units) Thermocouple characterization Difference calculation Square root calculation
Higher-level Functions
Intelligence
Math functions: +, -, x, ÷, square root, absolute value, logarithm, exponential functions, max, min, time average, group average, summantion, (maxmin), standard deviation, and integration.
Programming Method
Front Panel Remote
(downloaded)
Communications
RS-232C: serial point to point, 50 feet cable length maximum at 9600 baud; GPIB (IEEE-488): parallel (20 meter system cable length maximum, 2 meter distance between devices, up to 14 devices per controller); RS-422A/RS-485: Balanced/unbalanced, serial, up to 32 devices per system, cable length can extend to 1.2 km at 9600 baud.
Recorder Definitions
Hybrid Recorder: A recorder that combines analog trend
representation and digital measured value printing on the same chart
paper, without disruption of trend printing.
Servo Balancing: A means of positioning the pen of a drag pen
recorder. Null-balance operation has no current flow at balance, nullifying
the effect of lead resistance. Conventional servo balancing
recorders use contact mechanisms in the feedback loop and brushes in
the servo motor. New technology allows the use of a noncontact pen
positioning transducer and a brushless dc servo motor.
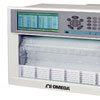
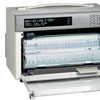
Scanning Recorder: A multi-point recorder that scans all of its inputs to obtain new measured data every set time period (usually 2 to 6 seconds). Printing for all points is often performed during each cycle of the printing mechanism.
Multi-color Printing: A recorder that records trend traces in more than one color to make traces easier to differentiate. Drag pen recorders use a different color for each pen (usually four pens maximum). Mulit-point recorders typically record in six colors.
Linear Scaling: Recording of a voltage input in terms of the engineering variable, such as temperature, that the voltage represents. Transformation is Y (variable to be recorded) = mX (slope x input signal) + b (Y intercept).
Pen Offset Compensation: In traditional multiple input drag pen recorders, each pen can travel the full width of the recording chart. In order to do so, the pens must be physically offset from one another. This puts the different pen traces on different time lines of the chart. By placing the measured data of the front-most pen(s) into a buffer and delaying their printing, the traces can be synchronized to the same time line, thereby compensating for their offset.
Accuracy: The closeness to the actual signal that the measured value or trend position takes, stated as either a percentage of full scale or percent of reading. Separate accuracy statements are typically provided for measuring and recording functions.
Tag ID: A means of designating a trace or digital measured value by an alphanumeric identifier instead of a numeric identifier. Typically available with up to seven characters.
Digital Printing: Printing of the precise measured numerical values for the various channels, along with their channel identifiers. Digital printing usually occurs in a margin of the chart so as not to interrupt trend recording.
Log Report: A printout of precise measured numerical values for the various channels, along with their channel identifiers. Typically prints in full character height per print cycle. During trending, prints on demand, resuming trending automatically. When trending is not being used, prints at a preselected time interval. May also include alarm status indication.
Can I send my 4-20 mA control
output to a chart recorder to
monitor a process input?
No. A control output is designed to
control a valve or some equivalent
control device. If you need to send
an analog signal to a recording
device, then choose a controller
that has a “retransmission or
recorder output” option.
 CLOSE
CLOSE

 Registradores de Gráfico
 Enregistreurs à chartes
 Graficadores de Cinta
 Graficadores de Cinta
 Chart Recorders
 Diagramoptagere
 Schreibern
 Registratori grafici
 Chart Recorders
 Registrador de Gráficos
 Chart Recorders
 Chart Recorders
 图表记录仪
图表记录仪 Chart Recorders
 チャートレコーダー
 Enregistreur graphique
 차트 레코더
 Chart Recorders
 Chart Recorders
 Chart Recorders
 Chart Recorders
 Chart Recorders